

Institutional Effectiveness
How Do We Compare?
-
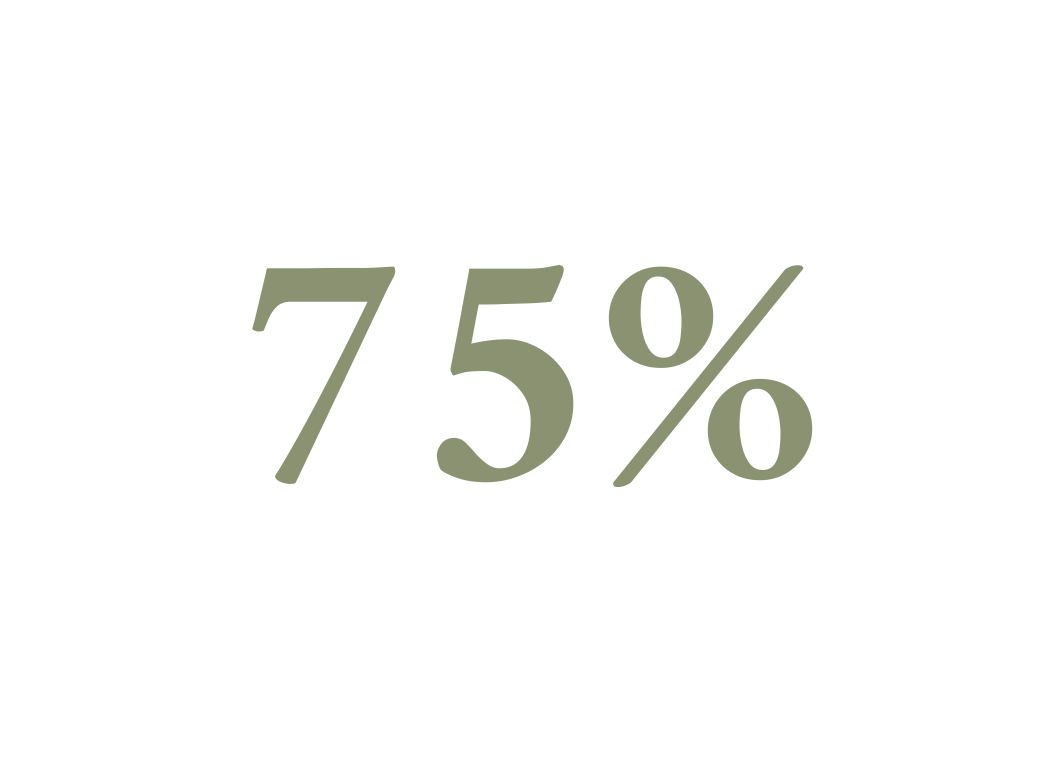
Graduation Rate
Compared to 68% National Average at Private Colleges
Graduation rates are calculated upon students graduating the program within 150% of program length. (For example, students who enroll in a four year program have six years to graduate to be included in this rate.)
-
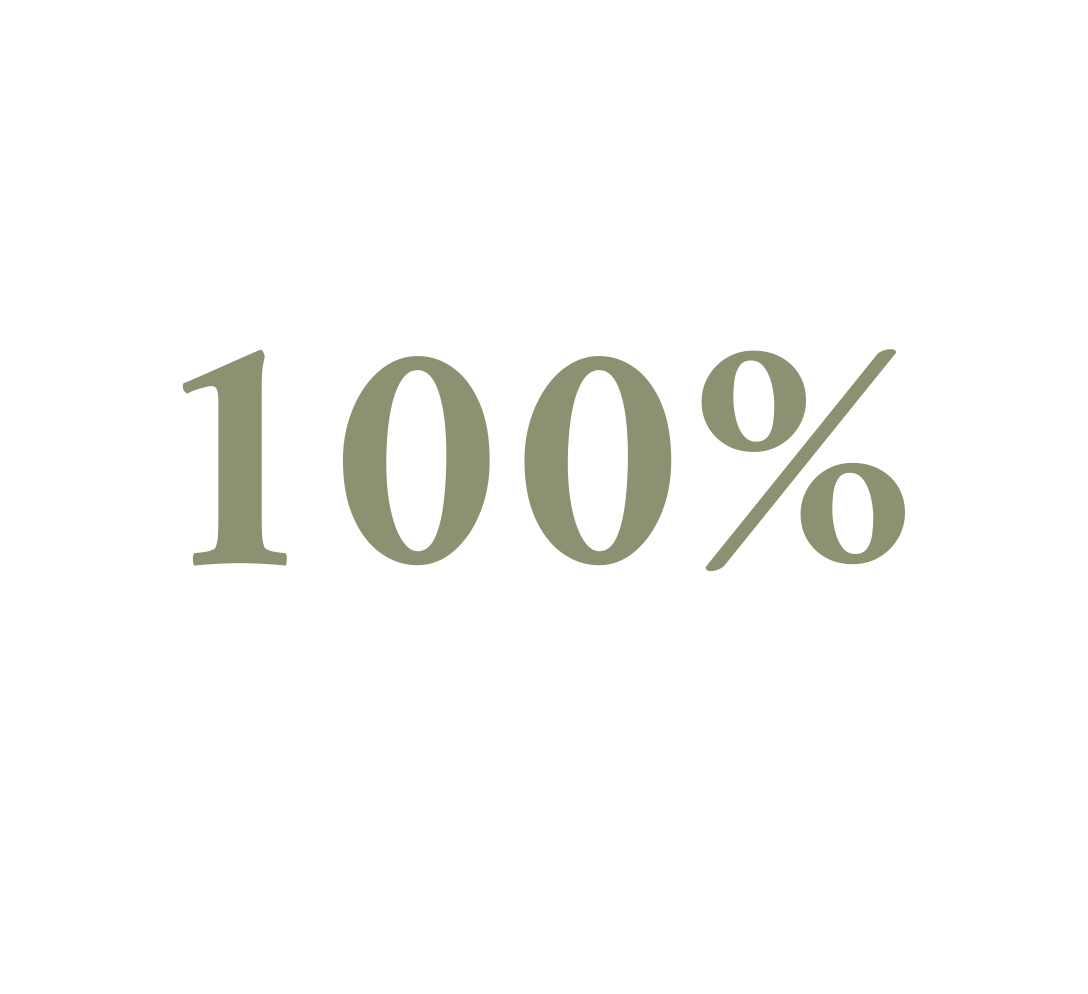
Job Placement Rate
Compared to National Average of 86%
Placement rates are the percentage of students who receive a job offer related to their education within three months of graduation with a bachelor's degree.
-
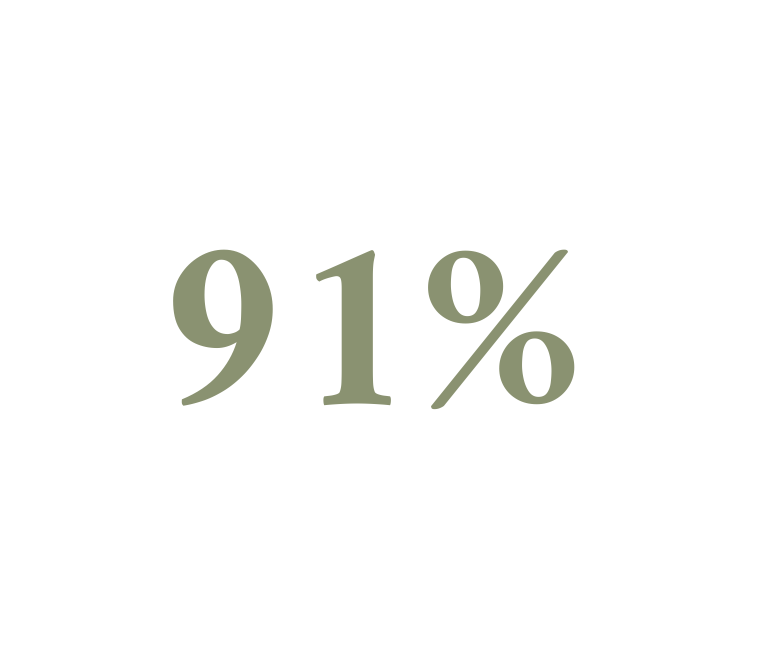
Acceptance Rate
An acceptance rate is based on the number of applications received versus the number of applications accepted.
-
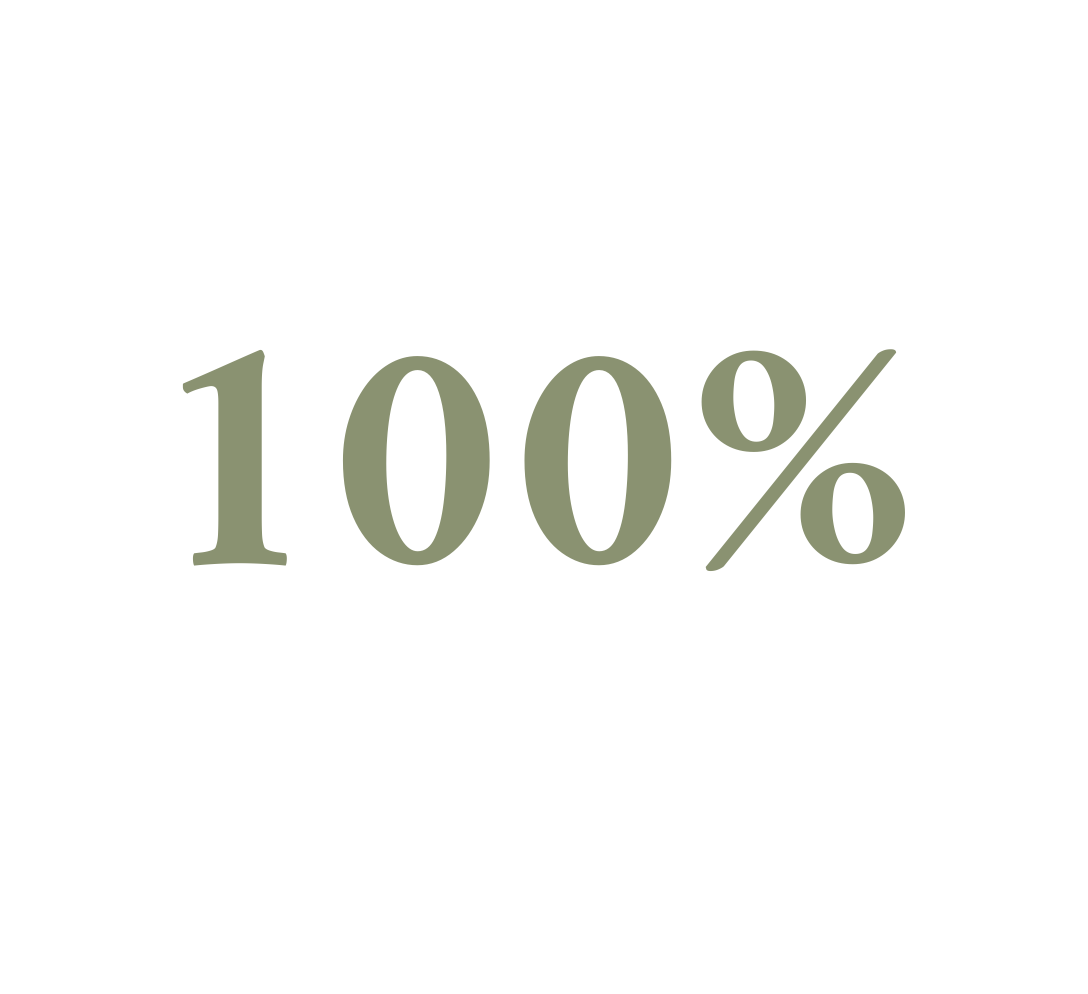
Students Receiving Financial Aid
100% of Institute students receive some form of financial aid. For incoming freshmen, the average aid package was $14,000 (covering the full cost of tuition). Estimate your aid HERE.
Institutional Goals

Academically Equipped.
Equipping students to continue their education at the next academic level.
Imparting abilities and passion for lifelong learning.

Professionally Prepared.
Preparing students to build the Kingdom of God in secular or ministerial occupations.

Spiritually
Mature.
Evidencing extensive knowledge of the Hebrew Scriptures and New Testament.
Demonstrating consistent practices of spiritual development.
Evidencing spiritual maturity.
Showing concern for using their education in service to God and others.

Mission Minded
Embracing responsibility to participate in the Great Commission.
Developing the ability to clearly articulate biblical truths and concepts.

Concerned for the Poor
Making consideration for the poor and marginalized through education, advocacy, or empowerment.
Program Outcomes
Student learning outcomes are assessed and evaluated on a annual basis (links to an external site).
THEC - Annual Performance Reports
The following reports, published to the Tennessee Higher Education Commission, detail demographic data, including graduation and placement rates. You can also view these reports on the THEC website.
Annual Performance Report, FY 2015-16
Annual Performance Report, FY 2016-17
Annual Performance Report, FY 2017-18
Annual Performance Report, FY 2018-19
Annual Performance Report, FY 2019-20
Annual Performance Report, FY 2020-21